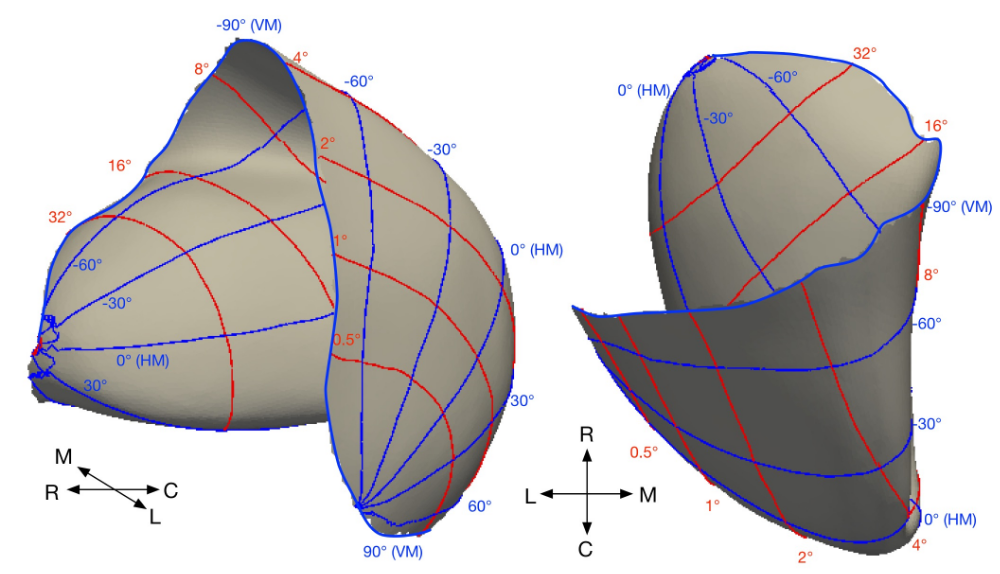
I created this figure to illustrate the retinotopic map of the primary visual cortex of the marmoset. The eccentricity contours are plotted in red, and polar angles are in blue. It’s very easy to create it in 3D so that you can rotate it around and see it from different angles. This is how you do it:
Download ParaView, the open source 3D data visualization package.
Download the published retinotopic data (Chaplin, Yu & Rosa, 2013). The relevant file is CNE_23215_sm_SuppDataS5.vtk.
Open the .vtk file in ParaView. Use solid colour to display the cortical surface of V1.
Select the .vtk file in the Pipeline Browser, then apply the Contour filter (there is a contour icon just above the Pipeline Browser). For the “Contour By” option, choose “Double_Sech_Polar_angle”. Enter a range of polar angle values in the “Isosurfaces” panel (0, 30, 60, -30, -60). Set Representation to “Wireframe” and then adjust the styles of the wireframe (set Line Width to 3). Click “Apply”. ParaView automatically makes the main surface invisible. Don’t worry, just make it visible again by clicking on the eye icon in the Pipeline Browser.
Apply a second Contour filter to the surface (that is, first select the .vtk file, then click on the Contours icon). This time, use “Double_Sech_Eccentricity” for contours.